Evaluating orthopedic implant production efficiency requires more than counting parts per shift. A titanium hip stem may leave a CNC cell quickly, yet still wait days for inspection, cleaning, or release. Those delays matter. So do scrap, rework, changeover time, and on-time delivery.
How to evaluate the production efficiency of orthopedic implants manufacturers begins with a clear boundary: track each product family from material issue to finished-goods release. Pair overall equipment effectiveness with first-pass yield, cycle time, labor hours per accepted unit, and work-in-process age. Separate routine production from validated processes and record the reason for every rejected part. A high output figure can hide costly rework. OEE alone can mislead.
The Deloitte and Manufacturing Institute 2024 report projects that 3.8 million U.S. manufacturing jobs may be needed by 2033, with 1.9 million potentially unfilled. This is a cross-industry forecast, not an orthopedic-specific benchmark. Still, it underscores why labor availability and skill coverage belong in an efficiency review. Lean manufacturing expert Shigeo Shingo cautioned, “The most dangerous kind of waste is the waste we do not recognize.” For implant makers, that waste might be a queue between machining and inspection, or repeated setup adjustments on a small-batch line.
Use consistent definitions, compare like products, and review trends over several months. Check the data against shop-floor observations. A dashboard cannot explain every delay. That is worth remembering. Metrics should prompt investigation, not reward speed at the expense of quality, traceability, or reliable release.
Defining Production Efficiency in Orthopedic Implant Manufacturing
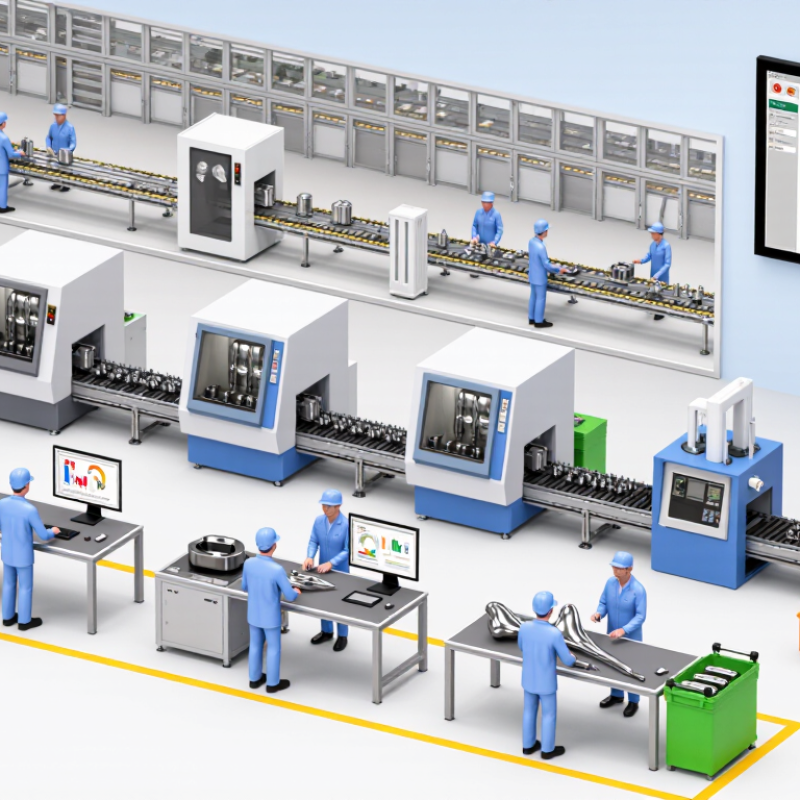
In orthopedic implant manufacturing, production efficiency is the reliable conversion of materials, machine time, and skilled labor into conforming devices. It is not simply units produced per shift. A line may machine many titanium components quickly, yet lose efficiency through dimensional rework, delayed inspection, or recurring setup adjustments. The useful question is whether output meets defined requirements consistently, without avoidable waste.
A practical view combines several measures: first-pass yield, cycle time, equipment availability, scrap, and on-time completion. For example, a milling cell’s cycle time matters only alongside tool-change delays and inspection queues. Track results by process step and product family; averages can hide one troublesome operation. Keep records tied to work orders and calibrated measurement results, so teams can distinguish a process shift from noisy data. This takes discipline.
Efficiency also depends on controlled production conditions. Stable work instructions, trained operators, preventive maintenance, and clear nonconformance handling can reduce variation. Yet measurement has limits: a short-term rise in output may reflect overtime, not a better process. No metric is perfect. Review trends with operators and quality staff, then test small changes against throughput and acceptance criteria. Some bottlenecks are mundane: waiting for a fixture, a clean machine handoff, or a decision about a borderline measurement.
Mapping the Production Workflow and Establishing a Baseline
An efficiency review should begin with the actual route an implant takes, not an idealized process chart. Follow one representative product family from material receipt through machining, cleaning, inspection, packaging, and release. Record each operation, handoff, queue, and approval point. A titanium component may spend only minutes under a cutting tool, yet wait hours for inspection or a production slot. Those pauses belong on the map.
Keep the map grounded in shop-floor observation. Note who performs each task, what equipment is used, and where records are entered. Distinguish processing time from waiting time, and mark steps that require documented checks or controlled handling. Small delays can hide between departments. That matters. A handoff recorded as “five minutes” may involve a much longer queue.
Build a baseline across a defined period, using comparable products and shifts. Track total lead time, machine utilization, first-pass yield, rework, downtime, and work in process. Define each measure clearly; otherwise, teams may count the same event differently. Pair speed measures with quality and traceability indicators, since a faster cycle is not useful if it creates inspection failures. Review the data with operators and quality staff. Their explanations may expose missing steps—or assumptions the map got wrong.
Selecting Metrics for Output, Quality, Cost, and Lead Time
Production efficiency is not simply the number of implants leaving a cell each week. Track accepted units per labor hour, and separate product families and process steps. A machined titanium component may need different handling and inspection time from another design. Compare like with like. Otherwise, a busy line can appear efficient while work-in-progress piles up.
Quality measures should include first-pass yield, scrap, rework, and nonconformance trends. A high output rate means little if many parts need another inspection or machining pass. Review results by operation, such as finishing or dimensional inspection, to locate recurring delays. Cost per accepted unit can combine labor, materials, machine time, and rework. Keep assumptions visible. Cost allocation is imperfect, and changing it can shift the apparent result.
Lead time should measure elapsed time from a released order to completed, accepted product, with waiting time recorded separately from active processing. That distinction helps reveal queues between machining, cleaning, and inspection. Track on-time completion too, but avoid treating one late order as proof of a failing process. Numbers need context. Review a small set of metrics regularly, check the underlying records, and revise measures that encourage rushed work or hide defects. A dashboard can still mislead.
How to Evaluate Orthopedic Implant Production Efficiency? - Selecting Metrics for Output, Quality, Cost, and Lead Time
Illustrative, anonymized operating dataset for a single orthopedic implant production line. Output is shown by quarter; other figures are quarterly averages. Targets are example internal planning targets, not universal industry benchmarks.
| Area |
Metric |
Definition |
Unit |
Q1 |
Q2 |
Q3 |
Q4 |
Example Target |
| Output |
Accepted units produced |
Units passing final inspection and released to inventory during the quarter |
Units / quarter |
11,800 |
12,400 |
13,100 |
13,700 |
≥ 13,500 |
| Output |
Overall equipment effectiveness (OEE) |
Availability × performance × quality for the monitored production equipment |
% |
68% |
71% |
74% |
77% |
≥ 75% |
| Quality |
First-pass yield (FPY) |
Percentage of units that pass the defined inspection process without rework |
% |
94.2% |
95.1% |
96.0% |
96.8% |
≥ 96% |
| Quality |
Scrap rate |
Percentage of started units permanently rejected and not recoverable through rework |
% |
2.1% |
1.9% |
1.6% |
1.4% |
≤ 1.5% |
| Cost |
Conversion cost per accepted unit |
Direct labor, machine time, and allocated manufacturing overhead; excludes raw materials and distribution |
USD / unit |
$485 |
$472 |
$460 |
$448 |
≤ $450 |
| Lead Time |
Order-to-ship lead time |
Average calendar time from confirmed order release to shipment, including applicable processing and inspection stages |
Days |
42 |
39 |
35 |
32 |
≤ 35 |
| Lead Time |
On-time delivery |
Percentage of orders shipped on or before the confirmed customer due date |
% |
88% |
90% |
93% |
95% |
≥ 95% |
Measurement note: Define product family, inspection criteria, costing rules, and lead-time start and end points consistently before comparing periods. Implant processes may include machining, cleaning, inspection, packaging, and sterilization, depending on the product and manufacturing scope.
Assessing Equipment, Workforce, Materials, and Compliance
Orthopedic implant efficiency is not simply units per shift. Track accepted implants per machine-hour, first-pass yield, setup time, and traceability completeness by product family. A titanium stem may wait for machining, inspection, or validated cleaning. The bottleneck moves. Record downtime by cause, not with one vague “machine loss” code. Small detail, big consequence.
A 2024 workforce study by Deloitte and The Manufacturing Institute estimates 3.8 million U.S. manufacturing job openings by 2033. It warns that 1.9 million could remain unfilled. This is a broad industry forecast, not an implant-plant benchmark. For each production cell, track skill coverage: who can verify gauges, maintain process settings, and investigate nonconformances? High output can still depend on one person.
Measure supplier delivery reliability, material-lot acceptance, scrap, and quarantine time. Link each alloy lot and process record to the device history. Faster machining can otherwise produce more held inventory. The FDA’s Quality Management System Regulation aligns U.S. device quality-system requirements with ISO 13485 and takes effect February 2, 2026. Review calibration, training, audit findings, and rework alongside throughput. Then question the dashboard: repeated manual data corrections may hide real delays, and another metric will not fix them.
Identifying Bottlenecks and Prioritizing Improvements
How to Evaluate Orthopedic Implant Production Efficiency?
Identifying Bottlenecks and Prioritizing Improvements
Efficiency problems often hide between machines. A titanium implant may leave CNC machining quickly, then wait days for finishing, cleaning, or inspection. Map each process step and record queue time, changeovers, first-pass yield, and unplanned downtime. Queues reveal trouble. Compare similar products and shifts; averages can conceal a struggling cell.
Prioritize the constraint, not the most visible machine. For example, if inspection queues grow while machining runs steadily, adding machining capacity may increase work-in-progress without improving delivery. Deloitte and MAPI’s 2019 smart-factory study estimated potential labor-productivity gains of about 12% from smart-manufacturing initiatives. Treat that figure as a broad benchmark, not a promised result for implant production. Test improvements on one product family, then verify effects on throughput and defect rates.
Staffing and skills can also limit output. Deloitte and The Manufacturing Institute’s 2024 workforce report projected 3.8 million U.S. manufacturing jobs could be needed by 2033, with 1.9 million potentially unfilled. Cross-training operators may reduce delays during absences, but it takes time and can expose weak work instructions. That is uncomfortable. Review the data weekly, and question any metric that rewards speed while rework or inspection backlogs rise.
How to Evaluate Orthopedic Implant Production Efficiency?
Identifying Bottlenecks and Prioritizing Improvements
The chart compares illustrative processing time per batch across common production stages. CNC machining and inspection take the longest in this example, making them candidates for closer review. These values are illustrative, not a published industry benchmark; use validated plant records to identify actual bottlenecks and prioritize improvements.
Conclusion
Evaluating orthopedic implant production efficiency begins with defining what efficient manufacturing means for the products, processes, and quality requirements involved. A clear assessment maps each production stage, from material preparation through machining, finishing, inspection, and release, then establishes a reliable baseline. This makes it possible to compare performance over time and understand how work moves through the facility.
The guide explains How to evaluate the production efficiency of orthopedic implants manufacturers by selecting practical measures for output, product quality, operating cost, and lead time. It also considers how equipment availability, workforce skills, material flow, and compliance practices affect results. By reviewing these factors together, manufacturers can locate bottlenecks, distinguish root causes from symptoms, and prioritize improvements that strengthen consistency and productivity without compromising product quality.

 WEX Medical